Create infographics with Wixie
In today's information age, infographics have become a popular way to communicate complex ideas and make large quantities of data understandable. Creating infographics in the classroom is a great way to get students practicing and using digital-age communication skills.
Students can combine Wixie's paint and imaging tools with text labels and call-outs to organize and share the information they are learning in the classroom.
Growing into Infographics
Students who have not worked to represent information visually need to grow their skills before they are ready to create stunning infographics with large amounts of data and information. Here are some ways you can help your students grow in these skills.
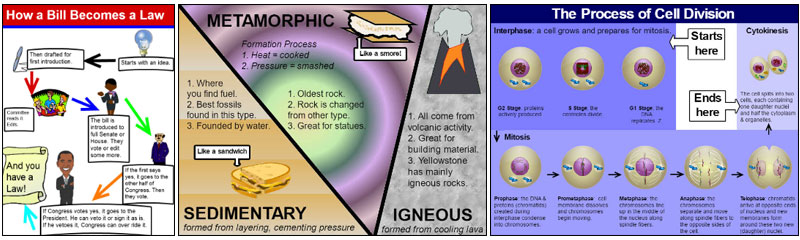
Visual diagrams
Young learners can easily create and label illustrations that show vocabulary and science processes.
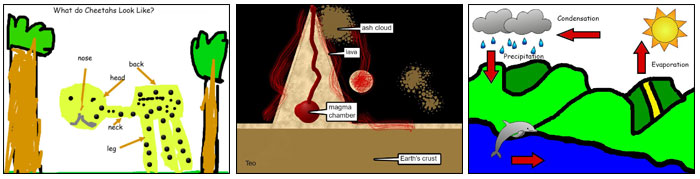
Research by Marzano et al. (2001) shows that “the more we use both systems of representation – linguistic and non-linguistic – the better we are able to think about and recall knowledge.”
Use the tools on the palette to paint and draw shapes.
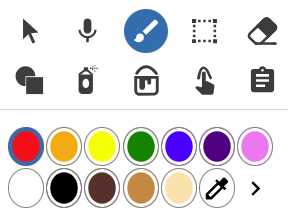
Add text labels with the Text button on the toolbar.

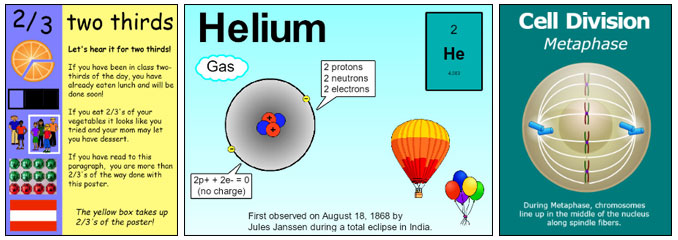
Infoposters
Infographics are designed to make large quantities of data easy to understand. Their counterparts, infoposters, are designed to quickly and effectively share information and ideas.
Students can easily use a combination of original artwork, images from the media library, or an online search and then add text labels and descriptions.
Infoposters are a great performance task you can use to evaluate student understanding. If students are new to this task, ask them to share a single piece of information, such as one part of a process.
Click the Image button on the toolbar to find and add images to help visualize information.

Students can use text options to change text to a speech bubble to create visual flowcharts.
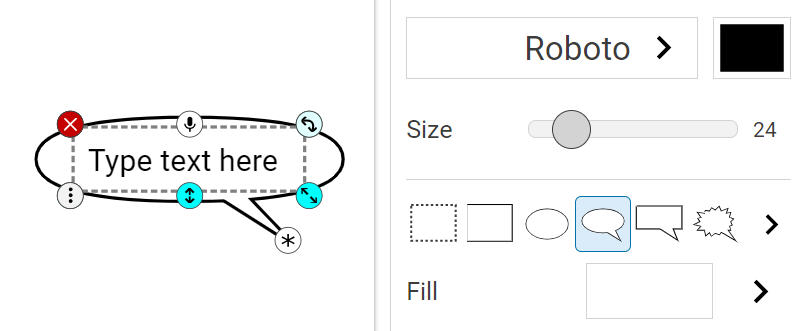
As students build their digital-age communication skills, ask them to visualize an entire process or share a more complex set of information.
Infographics
Students want to do real work in the classroom, not simply academic exercises. Infographics that are statements of priority and action are a great way to motivate students and ask them to apply communication skills to raise awareness and change minds.
As you can see from this What can you recycle? poster, the data does not have to be difficult, and the infographic does not have to be complex to be effective.
Make it matter!
As students grow in their visual communication skills, move them closer to working with larger amounts of data to visualize in their infographics.
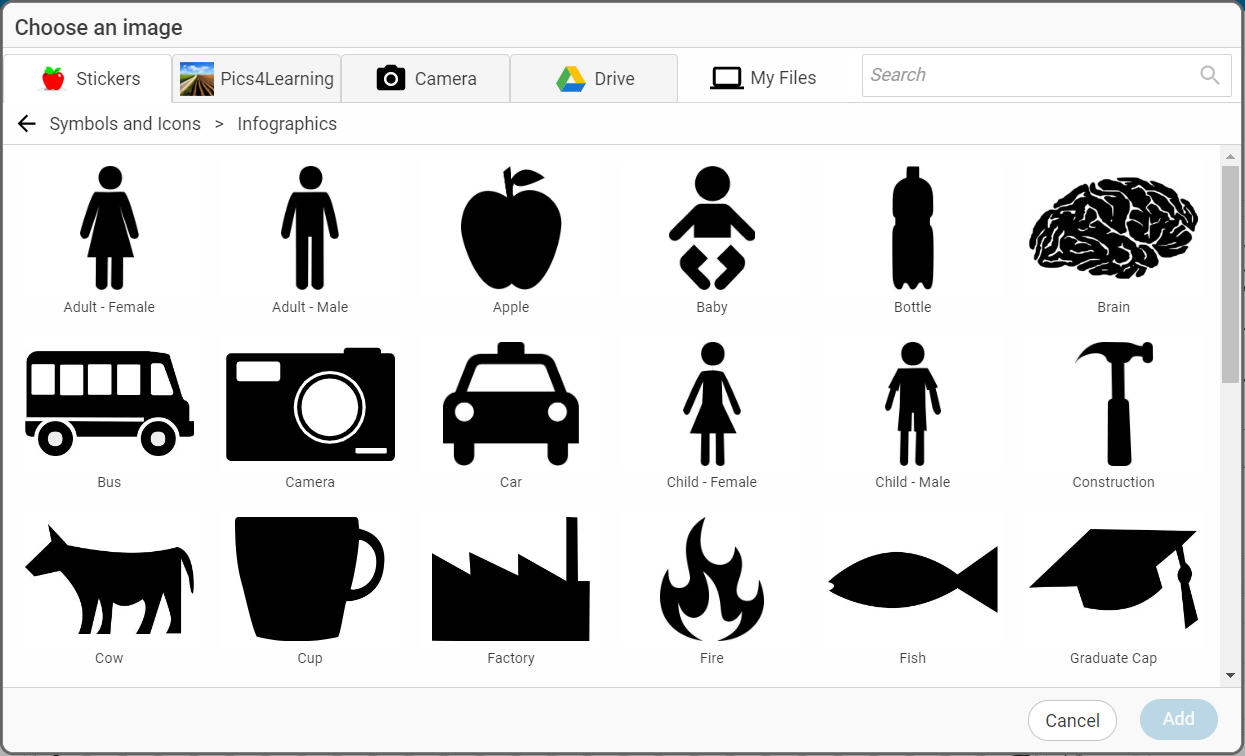
Wixie's media library includes a folder of images designed for data display. Click the Image button and open the Stickers library. Then, open the Symbols and Icons folder and the Infographics folder to find images designed for data display.
The more you can connect student work to real tasks, like raising awareness, the more motivated students will be.
Ask students to create an infographic about a favorite activity or issue. From camping to health to social media and conservation, infographics are a fun way for students to share their passions.
Get started
There are many ways to take advantage of this exciting digital-age communication medium. Creating infographics is not only motivating, but they engage students in building powerful digital-age communications skills that empower them to share learning and change minds.
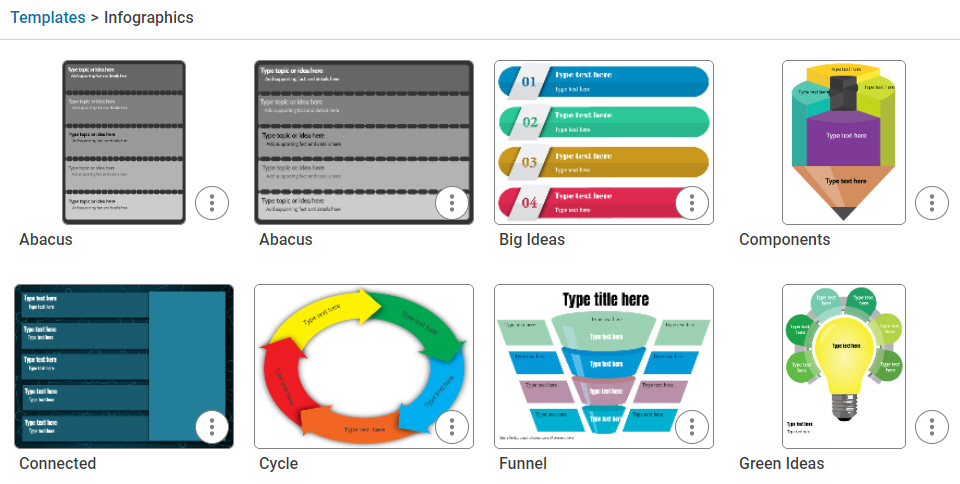
Students can even get started with a folder of infographic templates in the Design Templates library to help support their work.
Want a little more support to get started? Explore a complete Creating Infographic lesson plan.
 Effective Integration
 Instructional Design
 Learning Strategies
 Literacy
 Month-by-Month
 Product Ideas
 STEM/STEAM
 Share and Showcase
 Updates
 User Management