


Simple Surveys and Great Graphs
Grades: K-2
Simple Surveys and Great Graphs
Students work in teams to choose a question and survey their classmates. Teams then create bar graphs of the data, analyze the results, and share their findings.
Engage
A bar graph is a simple way to present data to someone that makes it easy to understand.
Show your students examples of graphs. See if students can already “read” it and answer questions like:
- What is this graph about?
- Which is the most popular option?
- Which is the least popular option?
- Who would care about this information?
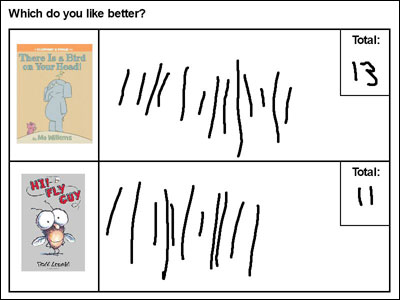
Read a story like Tally O’Malley by Stuart J. Murphy to get students thinking about using tally marks to collect data.
Create a two- or three-option survey and have students come up individually to make their tally mark.
Take the information from the survey you created and show students how to create a bar chart to show the information.
Create
Task students with creating their own survey and collecting data they will display in a bar graph. For example:
- Is vanilla or chocolate the best flavor ice cream?
- What pet should your teacher get for the class?
Ask students to share some ideas and record for everyone to see. Have students form teams of 3-4 students around a topic of interest.
Each team should use the tally template create a survey. Project each one on your whiteboard or print so students can collect data from each student in the class.
While students should create and collect survey data as a team, have individual team members create a bar graph to display the data.
Share
Print completed bar graphs to share with the class and discuss what each graph shows.
Common Core State Standards for Math
CCSS.MATH.CONTENT.1.MD.C.4
Organize, represent, and interpret data with up to three categories; ask and answer questions about the total number of data points, how many in each category, and how many more or less are in one category than in another.
CCSS.MATH.CONTENT.2.MD.D.10
Draw a picture graph and a bar graph (with single-unit scale) to represent a data set with up to four categories. Solve simple put-together, take-apart, and compare problems1using information presented in a bar graph.